
The shock came in weeks. The recovery is coming in months.
Airports, hotels, business activity, dining out, gold and property in the UAE since the regional conflict began on 28 February 2026: twelve months of public data, and where the next six months point.
◆ Built from Dubai Airports, Dubai DET, CoStar, JLL, SCAD, S&P Global, the World Bank, the World Gold Council, the Dubai Land Department, ValuStrat and ADREC, as published to 10 October 2026. Filled markers are reported or derived figures; hollow markers and hatched bars are Wusala estimates; dashed lines are Wusala forecasts.
About four-fifths of pre-war activity, and climbing
of pre-war, September (Dubai Airports). Low point 2.5m passengers in March, −66%.
August (DET), against 74% a year earlier. Low point 36% in March.
S&P Global PMI, September. Never below 50 (growth) through the shock; low 50.8 in June.
September, pre-war = 100. Wusala composite; no official series exists.
$4,194 on 9 Oct against the $5,502 record of 29 Jan. UAE jewellery demand −28% y/y in Q2.
Transactions Jan–Aug 2026, already above the AED 142bn of full-year 2025 (ADREC).
Dubai International is back to about 78% of pre-war traffic
Dubai International handled 2.5 million passengers in March, down 66%, and 6.3 million in July. Dubai Airports put September at 78% of pre-war. Our base case reaches about 87% by March 2027 and about 70 million passengers for 2026, in line with Dubai Airports' own revised guidance. Abu Dhabi and Sharjah have published no 2026 traffic; our estimates show Abu Dhabi recovering faster.
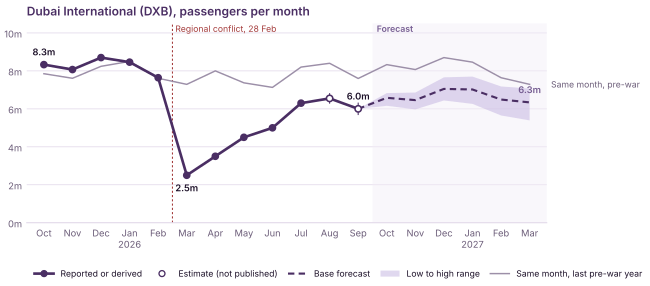
Dubai Airports (Mar–Jul 2026, Dec 2025 reported; other months split from reported quarters). Aug–Sep 2026 estimated from Dubai Airports' statement of 78% of pre-war. Forecast: Wusala.
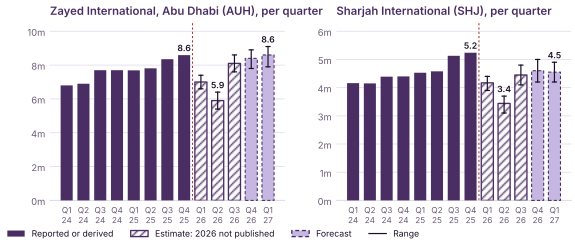
AD Airports and Sharjah Airport Authority (2024–2025). 2026: Wusala estimates from Etihad and Air Arabia traffic, AUH daily traffic in late June and Sharjah's July–August expectation.
Dubai occupancy nearly doubled from its March low; Abu Dhabi never fell as far
Dubai hotels fell to 36% occupancy in March and reached 66% in August. Abu Dhabi bottomed at 54% in March and was at 65% in June. Our base case puts Dubai at 75–80% in the fourth quarter, with the usual Ramadan dip in February 2027. Sharjah has published no 2026 hotel data, so we have not modelled it.
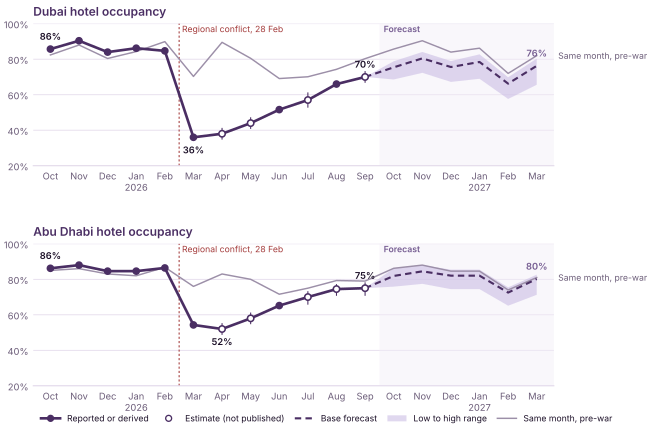
Dubai DET, CoStar, JLL (Dubai); CoStar, SCAD, DCT, JLL (Abu Dhabi). Unpublished months estimated. Forecast: Wusala.
The non-oil private sector kept growing through the shock
The S&P Global UAE PMI stayed above 50, the line between growth and contraction, in every month. It fell to 50.8 in June, its lowest in more than five years, and reached 55.3 in August and September, the fastest pace since 2024.
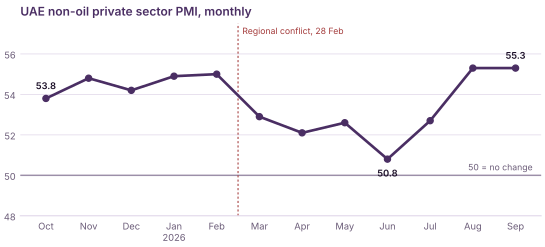
S&P Global UAE Purchasing Managers' Index, seasonally adjusted.
Dining out fell to 58% of normal in March and is back to about 84
No authority publishes restaurant visitor numbers, so this index combines the two things that fill tables: tourists (30% weight) and residents (70%). It sits between an operator survey that showed demand down 27% in early April and the 50–80% falls reported by tourist-dependent chains. Our base case reaches about 92 by March 2027.
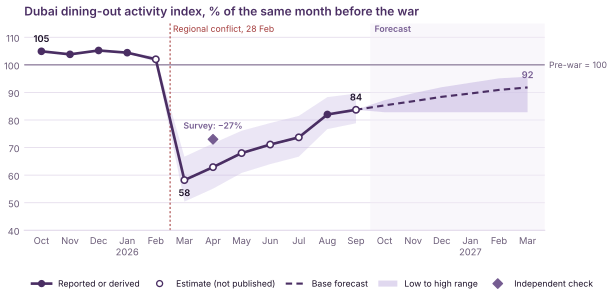
Wusala composite from DET overnight visitors, Dubai Airports, Redseer and S&P Global. Check point: operator survey reported by Reuters, 1 May 2026.
Gold is 24% below its January record; UAE buyers switched to bars and coins
Gold set a record of $5,502 on 29 January and fell as rate expectations rose; the Federal Reserve raised rates on 16 September. UAE jewellery demand fell 40% year on year in Q1 and 28% in Q2, while bar and coin demand rose about 30%. Every published bank target sits above today's price, but most were cut during the year, so we read them as the top of a realistic range.
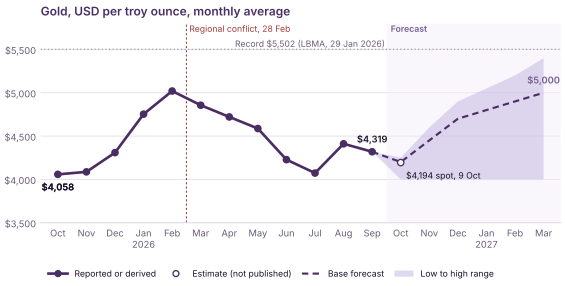
World Bank monthly averages, LBMA, Trading Economics. Forecast band: Goldman Sachs, Citi, UBS and JPMorgan targets; low case a retest of the July low.
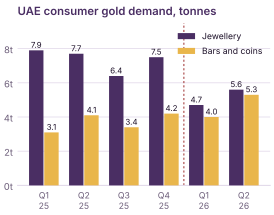
World Gold Council, Gold Demand Trends.
Dubai sales roughly halved; retail property held; Abu Dhabi kept growing
Dubai property sales fell from AED 70bn in January to about AED 30bn a month, and the ValuStrat price index is 9% below its January peak. Retail property was the steadiest segment. Abu Dhabi transactions for January to August already exceed the whole of 2025.
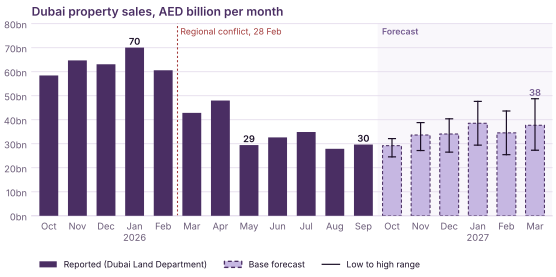
Dubai Land Department via Gulf News, Zawya, Arabian Business, fäm Properties and Emirates 24|7. Forecast: Wusala.
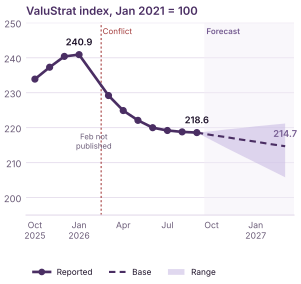
ValuStrat (February 2026 not published). Forecast: Wusala.
| Retail property | Before | Latest |
|---|---|---|
| Dubai retail vacancy (JLL) | 6.8% Q3 2025 | 4.7% Q2 2026 |
| Abu Dhabi retail vacancy (JLL) | 9.0% Q3 2025 | 8.9% Q2 2026 |
| Dubai super-regional mall rents, y/y (JLL) | +9.7% Q3 2025 | +8.5% Q2 2026 |
| Dubai new retail leases, y/y (Cavendish Maxwell) | – | −26% H1 2026 |
| Emaar malls occupancy | – | ~98% H1 2026 |
Our base case to March 2027
Assumes no renewed regional disruption. If disruption returns, the low case applies: airports and hotels hold at 75–80% of pre-war.
| Measure | Latest | Base, Mar 2027 | Low to high |
|---|---|---|---|
| Dubai airport passengers | 78% of pre-war | ~87% of pre-war | 74% flat to 97% |
| Dubai hotel occupancy | 66% (Aug) | 75–80% in Q4; ~76% in Mar | Low case: 80% of pre-war |
| Abu Dhabi hotel occupancy | ~75% (Sep, est.) | ~80% | 88% to 102% of pre-war |
| Dining-out index | ~84 | ~92 | 83 to 96 |
| Dubai property sales | AED 30bn a month | ~AED 38bn a month | AED 27bn to 49bn |
| Dubai price index (ValuStrat) | 218.6 | ~215 (−1.8%) | 206 to 221 |
| Gold, USD per ounce | $4,194 | ~$5,000 (bank median) | $4,000 to $5,400 |
How the numbers were made
Reported figures are as published. Derived figures come from reported totals by arithmetic only, such as a month split from a quarter by calendar days, or monthly occupancy backed out of year-to-date averages. Estimates fill months nobody has published and are drawn as hollow markers or hatched bars.
Each forecast is the pre-war level for the same calendar month multiplied by a recovery ratio: rising in the base case, flat in the low case, approaching full recovery in the high case. Seasonality comes from real pre-war months. Gold uses the median of published bank targets instead.
Base-case Dubai International traffic for 2026 is 70.5m passengers, against Dubai Airports' own guidance of about 70m. Base-case Dubai hotel occupancy averages 63.7% for 2026, inside Cavendish Maxwell's 60.4–66.2% range.
The dining index weights tourists at 30% by judgement (the band shows 20–40%). Dubai's resident-population fall rests on one source (Redseer). Abu Dhabi and Sharjah airports have published no 2026 traffic, so those bars are estimates.
Sharjah hotel occupancy (no 2026 data published), Dubai World Central passengers (never reported separately) and a monthly Dubai retail gold series (only single-day prints exist).
Research, not investment advice and not a forecast by any authority. Every figure carries its source in the full study; check any single number against the original before relying on it.
Seven pages, ten exhibits, every source and assumption.
Free to download. Subscribe to get the next edition, and the Wusala Indexes, when they are published.